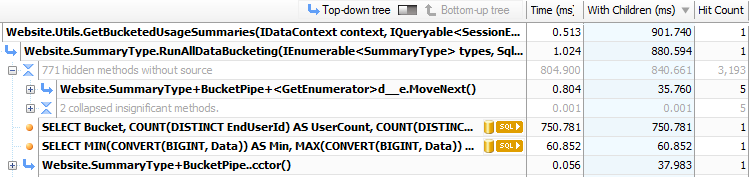
ANTS Performance Profiler
Trial
ANTS Performance Profiler is a code profiler for .NET, used to identify performance bottlenecks and improve the performance of your .NET applications, including ASP.NET web apps.Description
Reviews (15)
Q and A
Sign in to Write a Review
Sort By:
Saved me zillion of hours which I would most probably waste looking for the solution :) Redgate Ants and Memory profilers are definitvely the best piece of software I have used. It "saved my life" several times, and I on my must-have list of developing tools although I prefer to keep a small budget on developments tools. Working on a real-time Virtual Reality software, you understand that performance bottlenecks are something to avoid :) I am the author of the books "Ecrire du code performant en .NET" (ENI - May, 2011) and "Practical Performance Profiling" (Simple Talk - estimated February, 2012). When it came to chosing a profiler for my books, I selected the one that gave me the quickest results in my job, where I use most of the tools on the market, and it was ANTS Performance Profiler. I was really impressed with the tool. It took about 30secs to profile one of our asp.net applications and speed it up about 6 times by simply changing the way it connects to the database. ANTS Performance profiler is a great tool in any .net developers toolbox. It has great VS integration, and it's intuitive and functional interface makes it a pleasure to work with. It's easy to find problem areas, so use it regularly as a part of your development cycle, and fix the problem before it becomes serious. As a student these tools have proven absolutely invaluable in identifying bottle-necks and leaks in a timely manner. Excellent tools which I look forward to using over the course of my career. The best addon for Visual Studio. In the past I have used DevPartner Studio, and DotTrace for profiling. I have recently tried ANTS Performance Profiler Pro and find it much easier to work with in regards to profiling web applications. Just click a button and it works! Little or no configuration required. As with other profilers, the profiling goes all the way down to the database level and identifies the "Hot Spots" in the code. This is a great product! I had to find a way to speed up the solving time of a special search algorithm. I recently used Performance Profiler to track down a problem that had been in my task list for quite some time. It pointed right to the problem in just a few minutes! This tool has found a permanent home in my development tool box. At work, we were troubleshooting some performance issues with a web application. We needed to isolate a specific bottleneck. I tried ANTS and didn't need anything else because ANTS pin-pointed my specific issue. The feature that helped me the most was being able to set a time frame for analysis. That allowed me to drill right into the area of code that needed my attention. In addition to identifying the culprit of our specific issue, it also identified a new area that would become a problem. Not only that, but as a team member, I can have a specific objective analysis that I can report to my fellow developers. Instead of guessing how much CPU time a routine is using, I can objectively report on it. If you need to find bottlenecks FAST. If you need a tool that can show you only relevant data and it is enough to just LOOK AT IT in order to find the exact point. This tool is for you. Fantastic tool to find "bottlenecks" in your applications. Amazing tool. Hands-down winner. Easy to learn and use. Good Job Red-Gate! |