PerfWatson MonitorA real-time responsiveness monitor for Visual Studio's UI thread. |

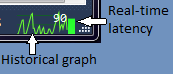
PerfWatson Monitor provides real-time monitoring of responsiveness on Visual Studio's UI thread. Installation is quick and easy. Just download the extension and install it (run the .VSIX and restart Visual Studio). The responsiveness monitor will appear in Visual Studio's status bar. A graph is displayed in the status bar showing the real-time and historical latency between messages processed on the UI thread. The current value is displayed in milliseconds.
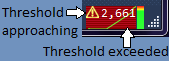
At 1.5 seconds, a warning triangle appears. If the delay exceeds two seconds, then the background of the historical graph will turn red.
The horizontal scale on the chart contains 50 sample points at 15 samples per second (3.333 seconds of samples). The vertical axis automatically scales depending on the highest sample value in that 3.333 second window. The graticule lines are set at 250ms intervals. Note: This extension collects and transmits anonymized usage statistics to the extension author for product improvement purposes. |